Turn First Visits Into Regulars.
Cuisine | Coffee & BakeryRefreshed Oct 1
| Metric | You | Benchmark |
|---|---|---|
| Signup to first visit | 79.8% | 71.5% |
| Signup to third visit | 24.6% | 33.0% |
| Loyalty share of sales | 21.3% | 18.0% |
| Online share of orders | 38.4% | 41.2% |





Know who’s coming back, who’s slipping, and what brings them in again.
We cover the whole path, so more of your first orders become fifth orders.
Our Guest Journey groups guests by how often they visit and what they spend, so you can see who’s active and who’s pulling back while there’s still time to act.
Each guest needs a different message. Our Marketing Suite sends it by email, SMS, or push, in the background, so it doesn’t add to your team’s workload.
Offers bring guests back once. A reason to return and an easy order make it a habit.


Repeat visits are easy to claim. Guest Journey and Loyalty Pulse prove them.
| Metric | You | Benchmark |
|---|---|---|
| Signup to first visit | 79.8% | 71.5% |
| Signup to third visit | 24.6% | 33.0% |
| Loyalty share of sales | 21.3% | 18.0% |
| Online share of orders | 38.4% | 41.2% |
Free Oat Cortado, Sep 8: average check up $0.38 and 0.4 more visits in the 30 days after redemption. Movement: of 486 guests who came in At Risk (Slider + Churned), 352 moved out of At Risk and 134 stayed At Risk.
Contribution Rate, San Francisco and 2 more locations, Sep 1 to Sep 30: 21.1%, up 1.2% on the previous period, against a system Contribution Rate of 17.1%.
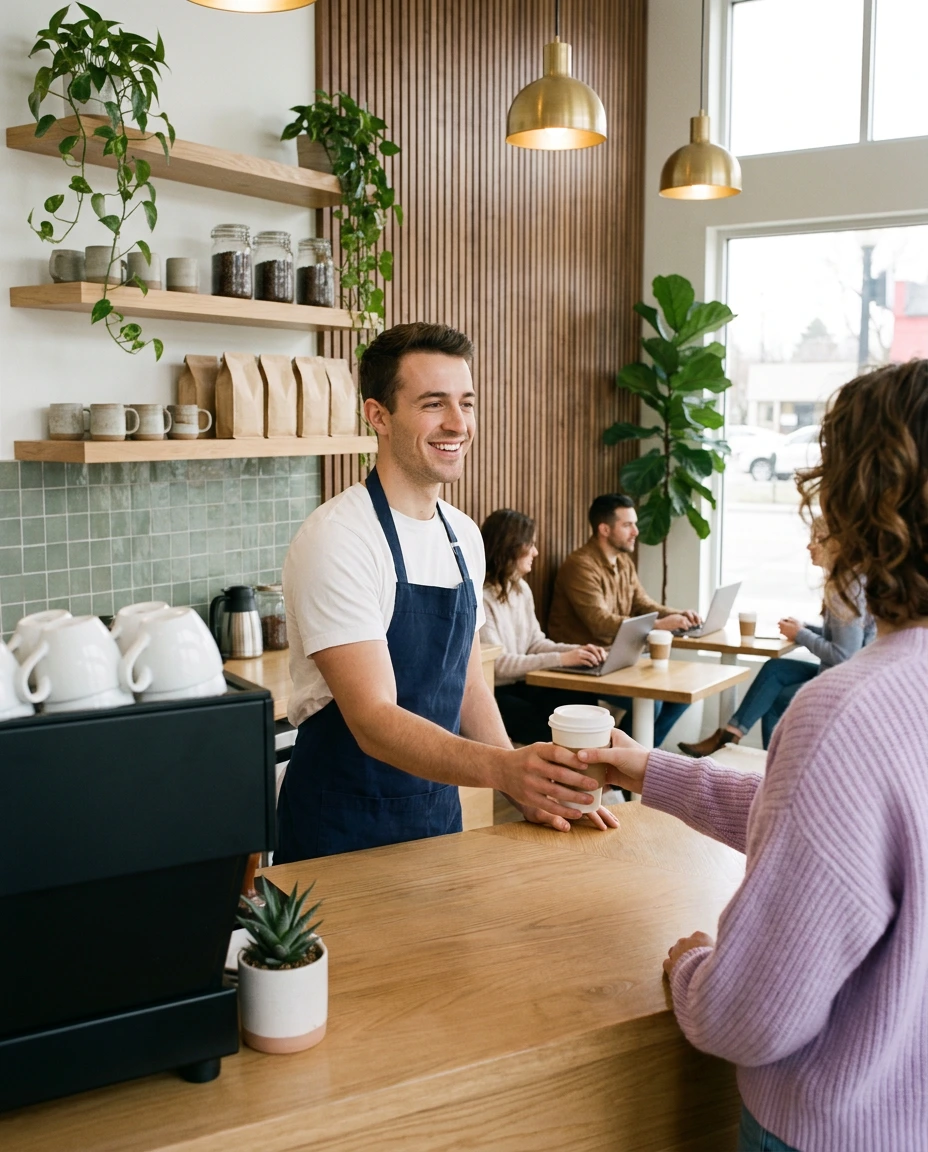
The fastest path to more repeat visits doesn’t start with spending more. It starts with knowing who’s about to stop coming in, before they do.
Book a DemoTalk to our team.
Book a Demo